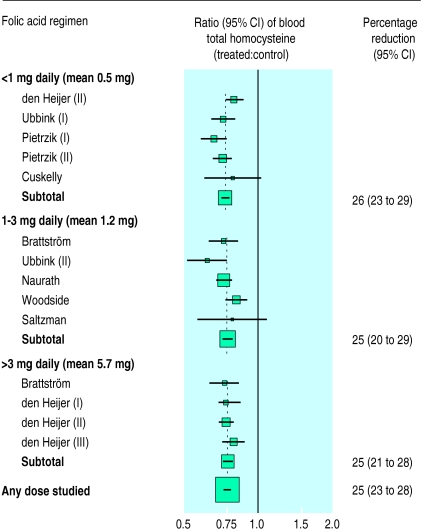
Figure 3.
Reductions in blood homocysteine concentrations with varying doses of folic acid at pretreatment blood concentrations of homocysteine of 12 μmol/l and folate of 12 nmol/l. Squares indicate the ratios of post-treatment blood homocysteine among subjects allocated folic acid supplements to those of controls; size of square is proportional to number of subjects, and horizontal line indicates 95% confidence interval

