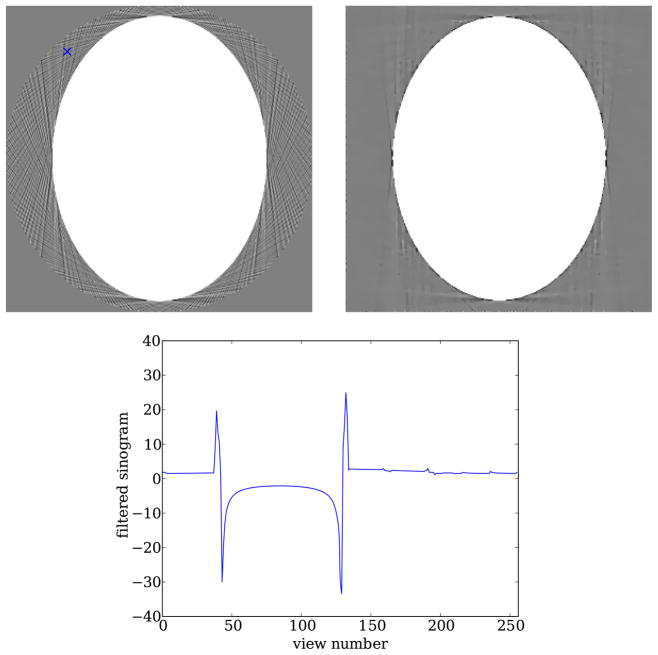
Figure 15.
Left: FBP reconstruction shown in a [−0.05, 0.05] gray scale window. Note the point indicated by the cross, when examining plot on the bottom. Right: same as the 512 × 512 TV-minimization image shown in figure 14 except gray scale window is changed to [−0.05, 0.05]. Bottom: plot of filtered sinogram values that contribute to the point indicated by the cross above. The strong, rapid variations occur for views where the cross lines up with a tangent of the skull. For a continuous sinogram, the ramp-filtered version diverges at such discontinuities. As a result, data discretization has a large impact near these singularities.

