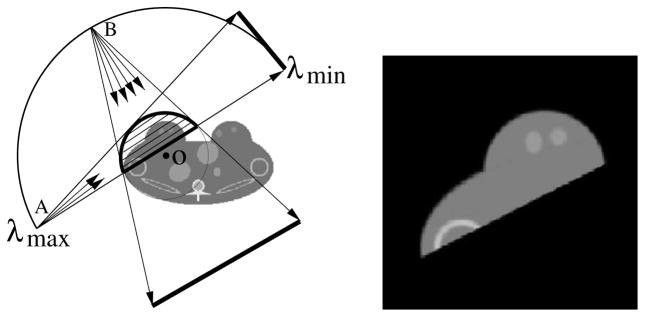
Figure 19.
Left: the region enclosed by the thick curve indicates the ROI for imaging, the thin curve between λmin and λmax indicates the source trajectory, and fan-beam rays from source points A and B denote two projections covering only the ROI. The BPF algorithm requires data collected over the angular range over an angular scanning range between λmin and λmax as long as the ROI is always covered by the fan-beam illumination at these scanning views. Clearly, the collected data contain transverse truncations. Right: ROI image reconstructed by use of the BPF algorithm from data containing transverse truncations.

