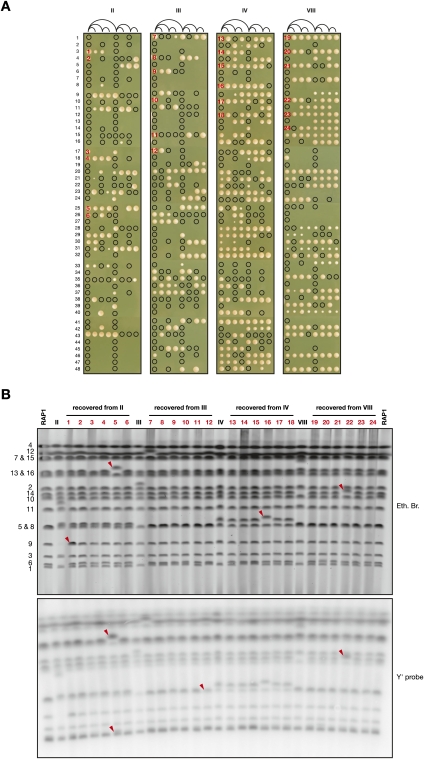
Figure 6.
Recovery from the fusions. (A) Clones II, III, IV, and VIII transformed with pRS306-RAP1 were grown exponentially in galactose-containing synthetic medium. (First position from the left) For each clone, 48 individual cells were plated on glucose-containing rich medium. After each of their three first divisions, cells were separated and repositioned on the same line, as indicated in the diagram, unless they failed to proceed through cytokinesis within a few hours. (That is, after a first division, one cell was left at the first position from the left, and the other cell was moved to the fifth position from the left. After a second division, one cell was left at its original position, and the other cell was moved to the third or the seventh position from the left, respectively, etc.). Colonies were photographed after incubation for 3 d at 30°C. A circle indicates the presence of a cell that failed to form a colony. The 24 colonies chosen for PFGE analysis are numbered in red. (B) Chromosomes from clones II, III, IV, and VIII transformed with pRS306-RAP1 grown in galactose-containing synthetic medium and from Lev1212 (RAP1) and the chosen 24 colonies grown in glucose-containing rich medium were separated by PFGE, labeled with ethidium bromide (top panel), and probed with a Y′ fragment (bottom panel). Changes are indicated with red arrows. In colony #1, chromosome 9 appears at two copies. In colony #5, the relative Y′ signal is increased for chromosome 6 or 1 and for chromosome 13 or 16. In colony #11, the Y′ signal is reduced for chromosome 5 or 8. In colony #22, the Y′ signal of chromosome 14 is increased.

