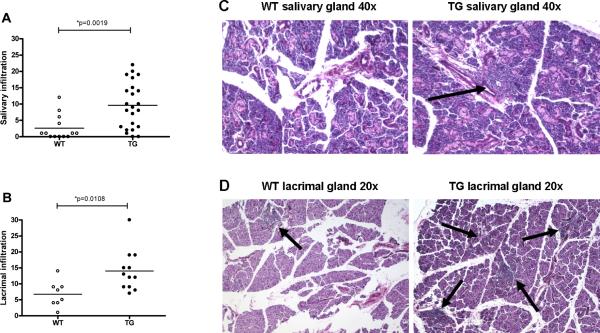
Figure 3. Salivary and lacrimal gland histopathology and scores.
A total number of 13 WT SGs, 23 IL-12 TG SGs, 8 WT LGs and 12 TG LGs were analyzed. Infiltrates in TG mice appear periductal and dispersed in the acinar tissue. Salivary (A) and lacrimal (B) histopathology scores; salivary (C) and lacrimal (D) histopathology in female SJL mice. TG mice show increased mononuclear infiltrates in both salivary and lacrimal glands. Horizontal bars are the mean value of each group. Significant differences are indicated (*) and were determined by non-parametric Wilcoxon's ranksum test. Arrows indicate lymphocytic infiltrates.

