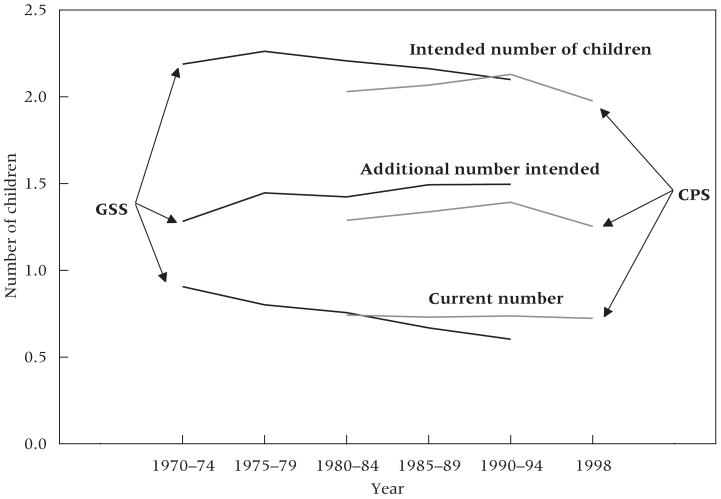
FIGURE 4. Current number of children, additional children intended, and implied intended number of children by survey year,a women aged 20–26, General Social Survey and Current Population Survey.
aFor the General Social Survey, the 1970–74 period includes data from 1972 and 1974; the 1975–79 period includes data from 1975, 1976, 1977, and 1978; the 1980–84 period includes data from 1982 and 1983; the 1985–89 period includes data from 1985, 1986, 1988, and 1989; and the 1990–94 period includes data from 1990, 1991, 1993, and 1994. For the Current Population Survey, the 1980–84 period includes data from 1980 only; the 1985–89 period includes data from 1985 only; and the 1990–94 period includes data from 1990 only.

