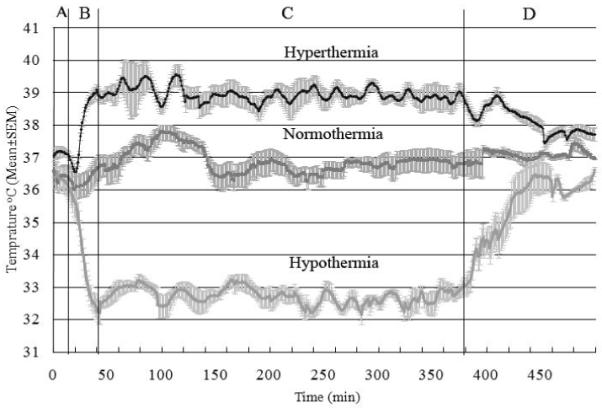
Figure 1.

Temperature recording of rats subjected to 7 mins of asphyxic cardiac arrest. These different cohorts received hyperthermia (upper), normothermia (middle), and hypothermia (bottom). The plots show temperatures during four different phases of the experiment. A: baseline and asphyxial cardiac arrest period with cardiaoplumonary resuscitation at 17 mins, B: temperature manipulation induction period, C: temperature manipulation maintenance period, and D: Temperature manipulation recovery period. The solid black line is mean temperature and gray field is SEM.
