
Figure 9.
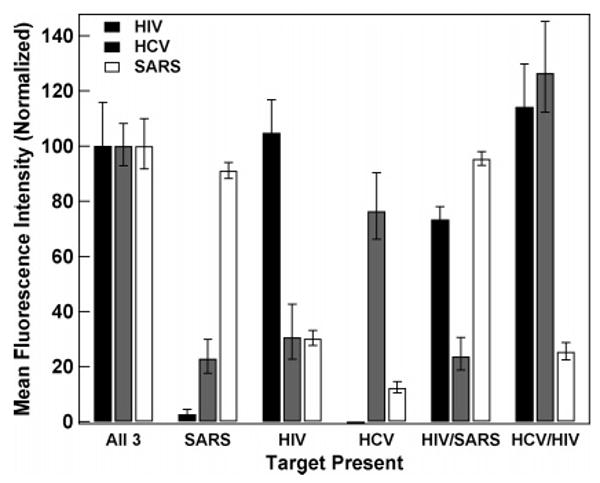
Triplex beacon assays performed and analyzed in a sealed chamber. The labels below the bar graphs indicate which target/targets are present in each assay. Background from a negative control (no targets added) has been subtracted from the data, and the intensity for each probe has been normalized to its intensity in the sample containing all three targets. The error bars shown are the 95% confidence intervals.