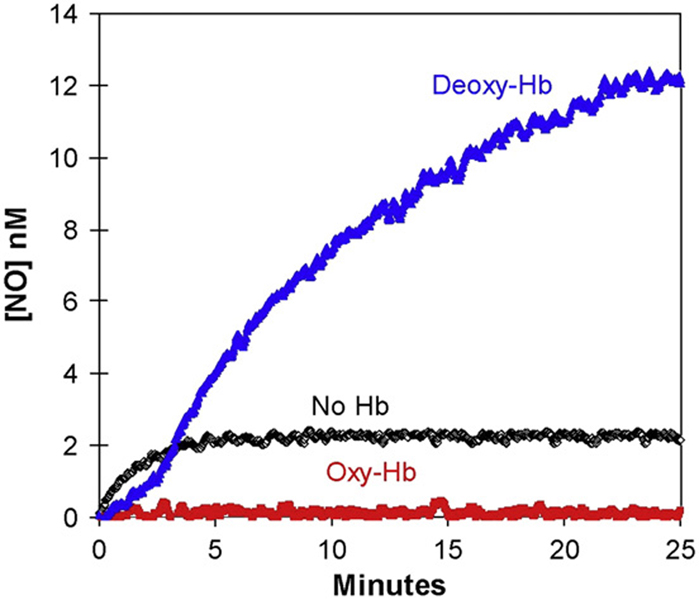
Fig. 3.
The time course of dissolved NO concentrations (obtained from m/z 30) on addition of nitrite to solutions containing (blue) 38 µM deoxy-Hb(FeII); or (red) 38 µM oxy-Hb(FeII); or (black) no hemoglobin. (These are heme concentrations.) At time zero, NaNO2 was added to attain a concentration of 8 mM. Solutions also contained 50 mM phosphate buffer at pH 6.8, 110 mM NaCl, 2 mM EDTA at 23° C. (For interpretation of the references to colour in this figure legend, the reader is referred to the web version of this article.)

