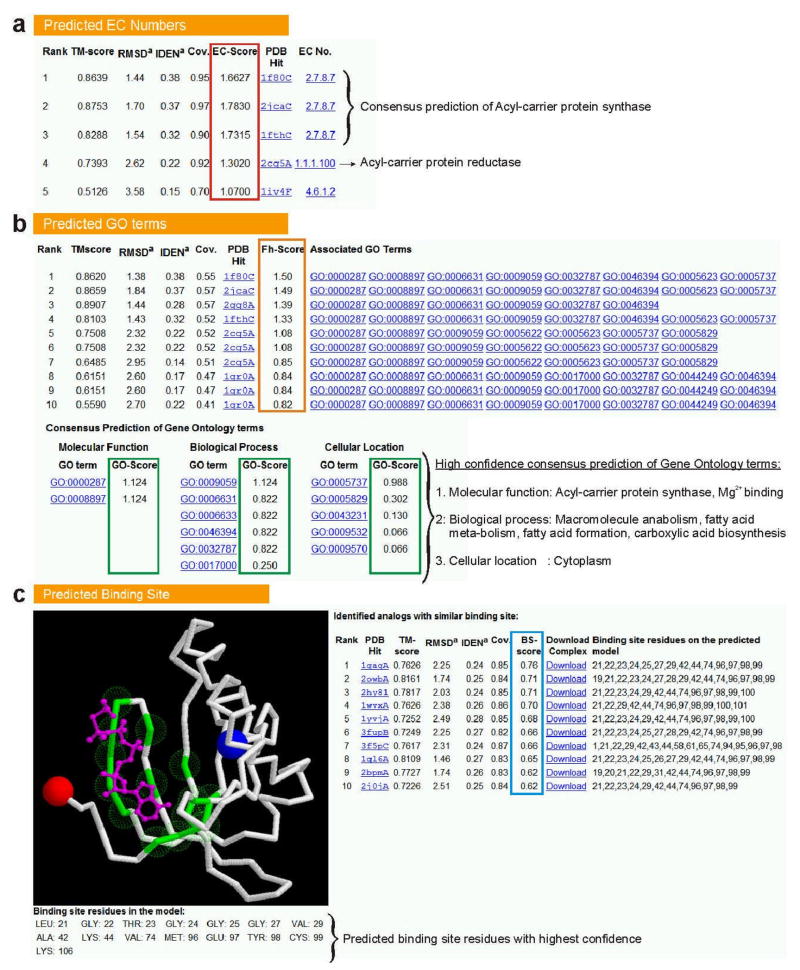
Figure 5.
Illustrative examples of the I-TASSER function predictions on (a) Enzyme Commission numbers; (b) Gene Ontology terms; and (c) ligand-binding sites. The confidence level of the function prediction on EC number and binding site is shown in EC-score and BS-score columns (highlighted in red and blue rectangles, respectively). For GO, the analogs are first sorted based on Fh-score (in orange rectangle) and then a consensus of the predictions is derived from the top-scoring analogs and the confidence score of the GO prediction is defined as the ‘GO-score’ shown in green. The image in (c) shows the top-scoring binding site prediction in 3D model along with the bound ligand (in magenta), where the binding residues in protein are shown as transparent green spheres. The N- and C-terminus residues are marked by blue and red spheres, respectively.

