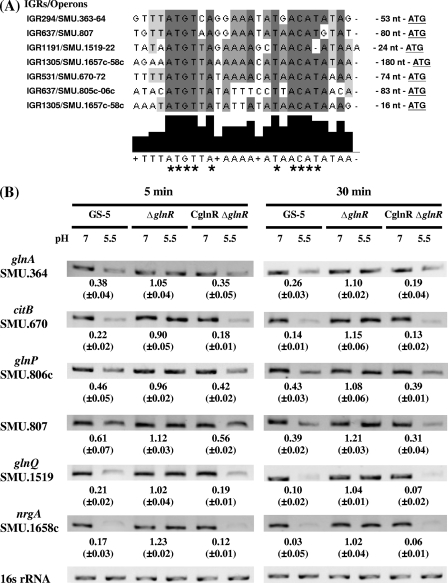
FIG. 3.
GlnR was involved in the acid repression of clusters of genes encoding proteins involved in amino acid metabolism in S. mutans. (A) Alignment of the putative GlnR box in the 5′ UTRs of acid-repressed genes encoding proteins involved in amino acid metabolism. The nucleotide sequences of the 5′ UTRs of downregulated genes were aligned using the ClustalW2 multialignment sequence analysis program (http://www.ebi.ac.uk/Tools/clustalw2). Nucleotides that are identical in all sequences are shown on dark gray background in the sequence alignment and indicated by tall black bars below the sequence alignment and by asterisks. Nucleotides that show 50% identity in the nucleotide sequences are shown on light gray background and shorter black bars below the sequence alignment. The intergenic regions (IGRs) and operons are shown to the left of the sequence alignment. The distance (in nucleotides) between the GlnR box and the translational start sites is listed to the right of the sequence alignment. (B) The expression of each gene in the wild-type, ΔglnR, and CglnRΔglnR strains after 5 and 30 min of acid adaptation. Specific primers were used to amplify each gene by RT-PCR. The mean values of the change in expression (fold change for expression of the gene in bacteria grown at pH 5.5 compared to expression of the gene in bacteria grown at pH 7.5) from three independent experiments with three replicate samples in each experiment (n = 9) are depicted below the blots after the intensities of 16S rRNA signal were normalized. When necessary, a higher dilution of cDNA was used in PCRs to avoid the saturation effect. The standard deviations are shown in parentheses.

