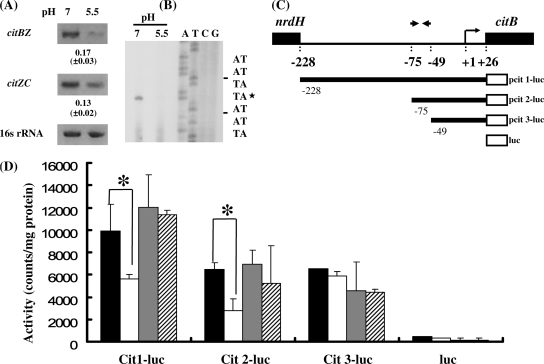
FIG. 5.
The palindromic sequence was involved in the regulation of citBZC at acidic pH. (A) Expression of the citBZC operon under neutral and acidic pH values. The polycistronic messages of citBZ and citZC were analyzed by RT-PCR with primer pairs SMU.670F-citZR78 and citZF1013-citCR122, respectively. The mean values of the change in expression (fold change for expression of the gene in bacteria grown at pH 5.5 compared to expression of the gene in bacteria grown at pH 7.5) were calculated and listed below the blots as described in the legend to Fig. 3. (B) Primer extension analysis of the citBZC operon. Total RNA was isolated from the wild-type strain (GS-5) exposed to pH 7.5 and pH 5.5 for 30 min. Primer citBR49, 49 bp 3′ to the ATG codon, was used in the cDNA extension and sequence analysis. The transcription initiation site (TIS) (+1) is marked by an asterisk. (C) Diagram of series of amplicons containing various lengths of the upstream region of citB (the chromosomal Cit1-luc to Cit3-luc strains). The relative positions of each promoter-luc fusion, the inverted repeat, +1 site, and ATG start site of citB are indicated. (D) The luciferase activities in the promoter-luc fusion strains. Luciferase activities from GS-5 cells not exposed to pH 5.5 (unadapted) (black bars), GS-5 cells exposed to pH 5.5 for 30 min (white bars), unadapted ΔglnR cells (gray bars), and ΔglnR cells exposed to pH 5.5 for 30 min (hatched bars) are shown. The means plus standard deviations (error bars) for three independent assays are shown. Statistically significant differences (P < 0.05, Student's t test) are indicated by asterisks.

