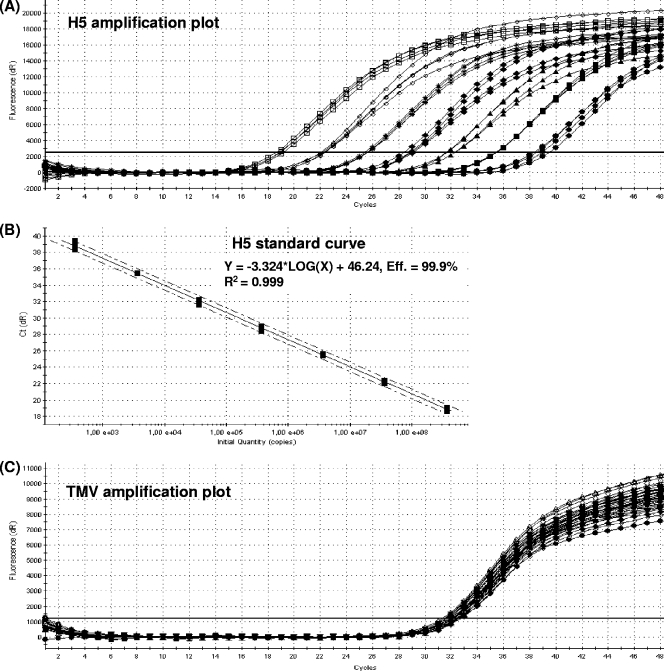
FIG. 1.
Amplification plots for H5 HA RNA and TMV detection. (A and B) FAM fluorescent signals (A) and corresponding standard curve generated from a 10-fold dilution series (B) of H5 HA RNA (the 95% confidence limits for the standard curve are indicated by dashed lines in panel B). From left to right, the curves in panel A show results for RNA concentrations ranging from 2 × 10⁸ to 200 copies per reverse transcription reaction performed with four replicates. (C) HEX fluorescent signals generated from the internal TMV control, demonstrating that all samples had a satisfactory TMV CT (i.e., a CT within 2 standard deviations of the mean), irrespective of the concentration of the HA RNA target.

