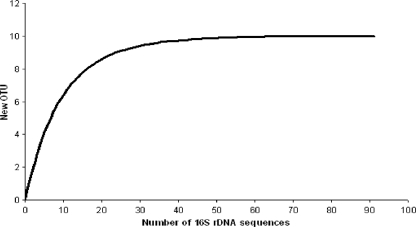
FIG. 2.
Evaluation of the representation of the bacterial clones obtained from the limestone rock from Beer by rarefaction analysis. The appearance of new OTU strains was plotted as a function of the number of clones, which were analyzed randomly. The rarefaction curves were generated using FastGroupII (49). The curve was calculated with sequence similarity cutoff values of 97.0% (species level).

