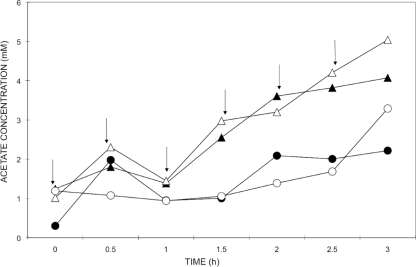
FIG. 4.
Acetate concentration in activated sludge in the presence (circles) or absence (triangles) of sodium nitrate over 3 h. Closed symbols show the acetate concentration in samples pulsed with [12C]acetate, while the open symbols show the acetate concentration in the treatments with [13C]acetate. Arrows show the six time points at which the labeled pulses were added. The data were gathered from a single reactor per treatment.

