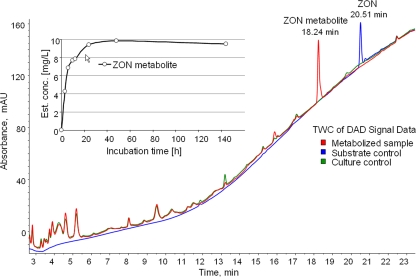
FIG. 1.
Comparison (large graph) of the total wavelength chromatogram (TWC) of the metabolized sample (red curve) and the culture (green curve) and the substrate (blue curve) control samples after 144 h of incubation. In the metabolized sample the substance causing the most intense peak (at 18.2 min) was identified as the ZON metabolite (ZOM-1). Depiction (inset) of estimated concentration of the ZON metabolite ZOM-1 during an incubation experiment of 10 mg/liter ZON with Trichosporon mycotoxinivorans.

