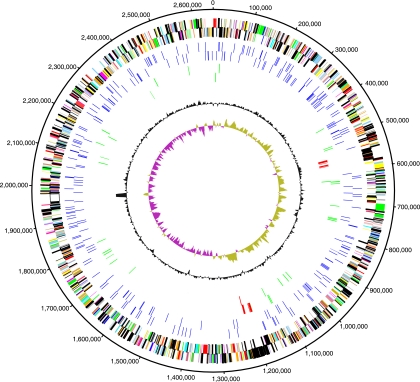
FIG. 1.
Diagram of the P. arcticus 273-4 genome. The outermost two circles (circles 1 and 2) show the genes in the forward and reverse strands, respectively; different colors indicate different function categories. The next two circles (circles 3 and 4) show the class 1 repeat elements in the forward and reverse strands, respectively. Circles 5 and 6 show transposons and IS elements (green) and prophage (red) in the forward and reverse strands, respectively; circle 7 shows the GC content; and circle 8 shows the GC skew.

