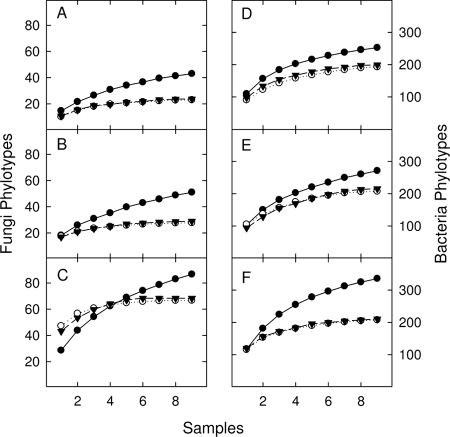
FIG. 1.
Site-averaged rarefaction curves for fungi (A to C) and bacteria (D to F) determined using three sampling strategies. Filled circles, no pooling; open circles, pooled prior to PCR; filled triangles, pooled prior to DNA extraction. At each site, three separate rarefaction curves were generated using the nine biological (no pooling) or nine technical (pooled procedures) replicates from each plot. Sites represented in the panels are as follows: ARDEC corn field (A and D), TNR tropical rainforest (B and E), and YG ponderosa pine forest (C and F).

