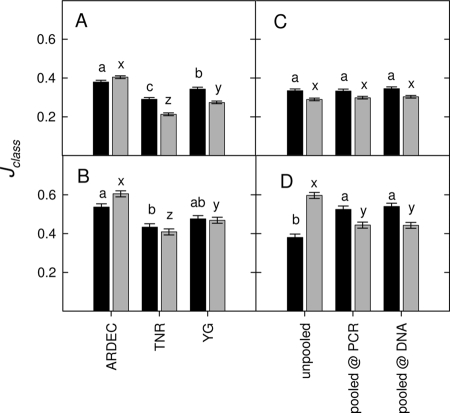
FIG. 2.
Average Jaccard similarity index (Jclass) between the three plots at each site (ARDEC corn field, TNR tropical rainforest, and YG ponderosa pine forest). Jclass (phylotype presence/absence) was calculated between the three plots at each site using each individual ARISA profile (A and C) or a single composite ARISA profile (i.e., average of all nine biological [no pooling] or nine technical [pooled procedures] replicates) for each plot (B and D). Averages are reported by site (A and B) or sampling procedure (C and D). Black bars, fungi; gray bars, bacteria. Bars are the LSmeans with the pooled standard error (SE); bars with different letters denote significant Tukey's HSD test results (P < 0.05).

