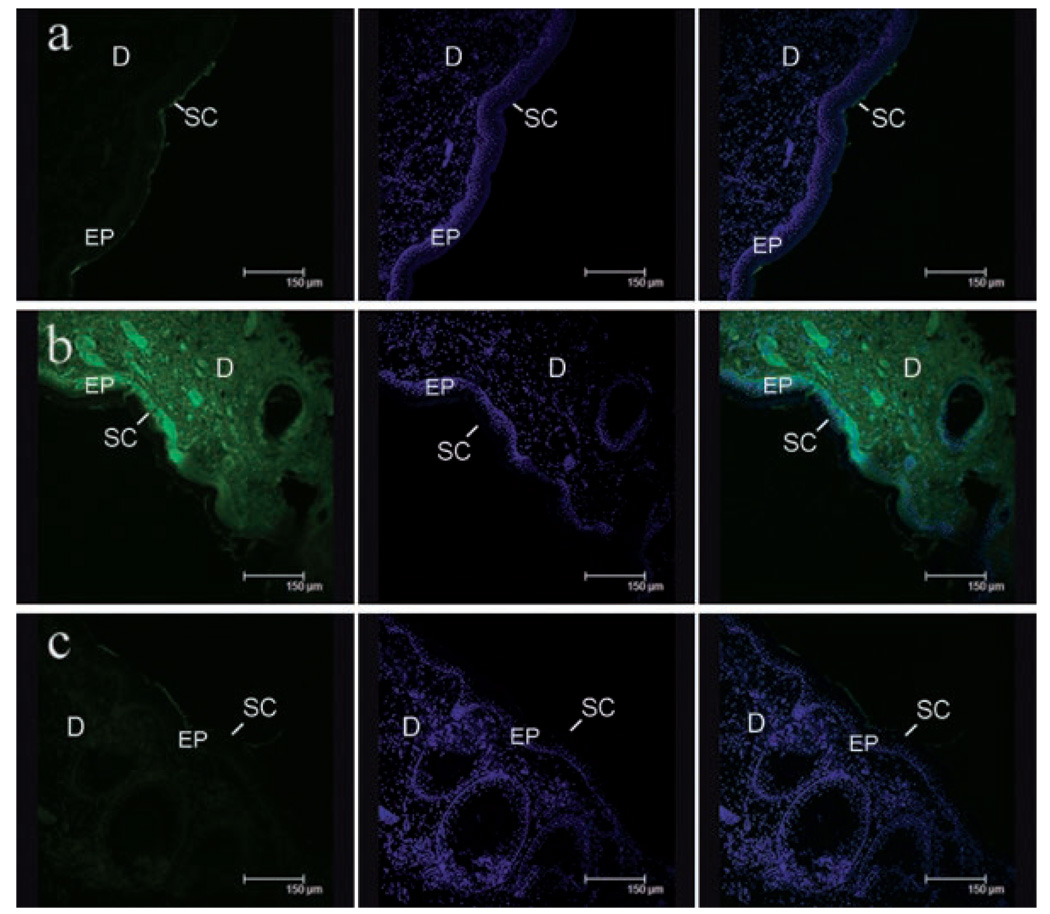
Figure 9.
Confocal images of (a) natively hydrated, (b) highly hydrated, and (c) restored porcine skin tissue after FITC-BSA was loaded for an hour. The three vertical columns shows images of skin tissue obtained through the FITC channel (left), the DAPI channel (middle), and an overlay of FITC and DAPI channels (right). The green color indicates presence of FITC-BSA while the blue color shows the DAPI-stained cell nuclei. Scale bar = 150 µm. SC, stratum corneum; EP, epidermis; D, dermis.

