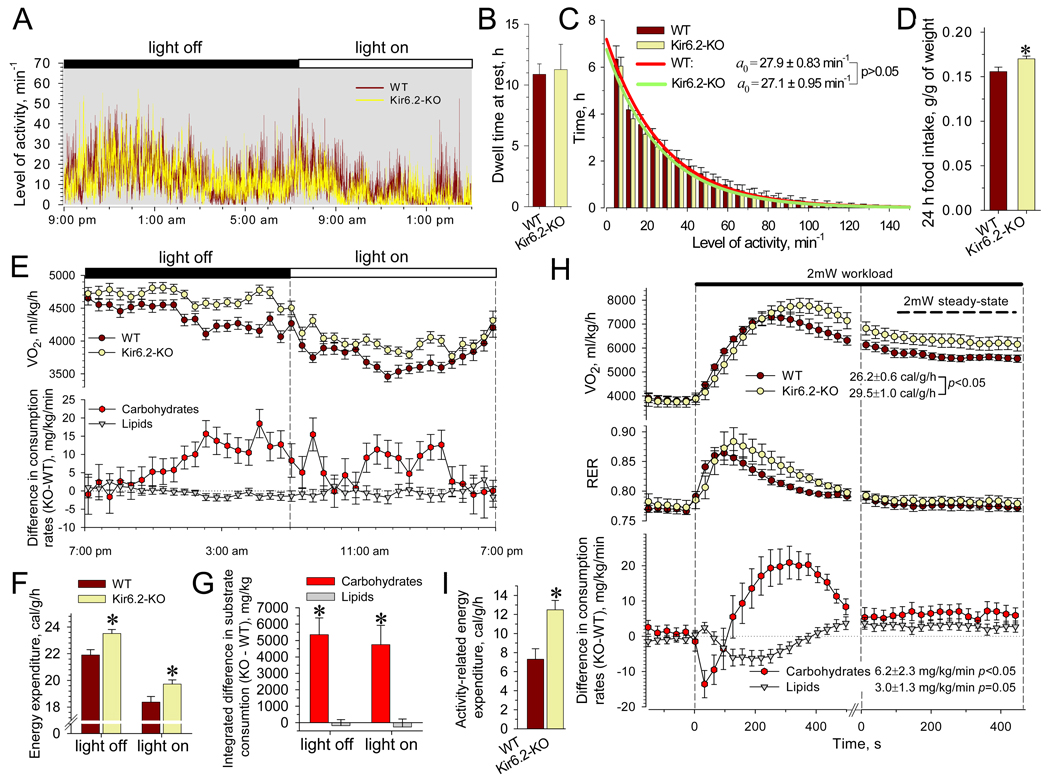
Figure 2. Activity, food intake and EE in WT and Kir6.2-KO.
(A) Records of continuous locomotive activity monitored using implanted transmitting devices.
(B and C) Dwell time spent without movement was indistinguishable between WT and Kir6.2-KO (n=8 for each group). Fitting of the activity distributions, solid curves, revealed mean characteristic activities indistinguishable between WT and Kir6.2-KO.
(D) Food intake with regular chow diet, accumulated over 24 h and corrected for body weight, was higher in Kir6.2-KO (n=14) versus WT (n=16).
(E) Average time-course of oxygen consumption rates (V̇O2), and difference of substrate consumption rate calculated for Kir6.2-KO (n=19) relative to WT (n=17). Data points represent the average of 3 measurements from each animal.
(F) EE calculated based on V̇O2 and V̇CO2 values and averaged separately for light-on and light-off periods was higher in Kir6.2-KO versus WT.
(G) Cumulative substrate utilization obtained by integration over light-on and light-off periods revealed elevated carbohydrate consumption in Kir6.-KO compared to WT. Lipid utilization remained equivalent.
(H) V̇O2, respiratory exchange ratio (RER) and substrate consumption rates in WT (n=8) and Kir6.2-KO (n=8) were obtained within 30 s intervals during 2 mW treadmill test. At steady-state, Kir6.2-KO displayed an elevated EE compared to WT, accompanied with raised rates of substrate utilization.
(I) Activity-related EE was higher in Kir6.2-KO versus WT (n=8 in each group).
Data are mean±SEM; *, p<0.05.

