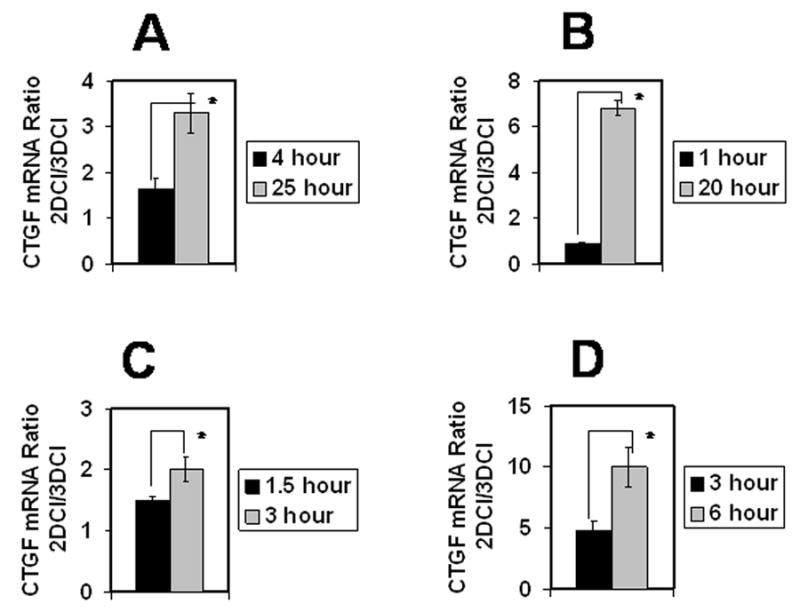
Figure 2. Three-dimensional collagen I culture downregulated CTGF in many cell types.

Breast carcinoma MDA-MB231 (A), rat cortical neurons (B), fibrosarcoma HT1080 (C), and HUVEC (D) were cultured atop 3DCI and on thin layer collagen I for indicated periods of time. Real time RT-PCR was performed to evaluate CTGF mRNA expression. Ratio of CTGF mRNA expression on 2DCI versus 3DCI was quantified with 2-ΔΔCt method. Ratio equal to 1 represents no change, greater than 1 denotes an increase, and lower than 1 shows a decrease between the compared conditions. Experiments for each cell type were performed twice, averaged and plotted as mean ± standard deviation, *, p<0.05.
