
Fig. 3.
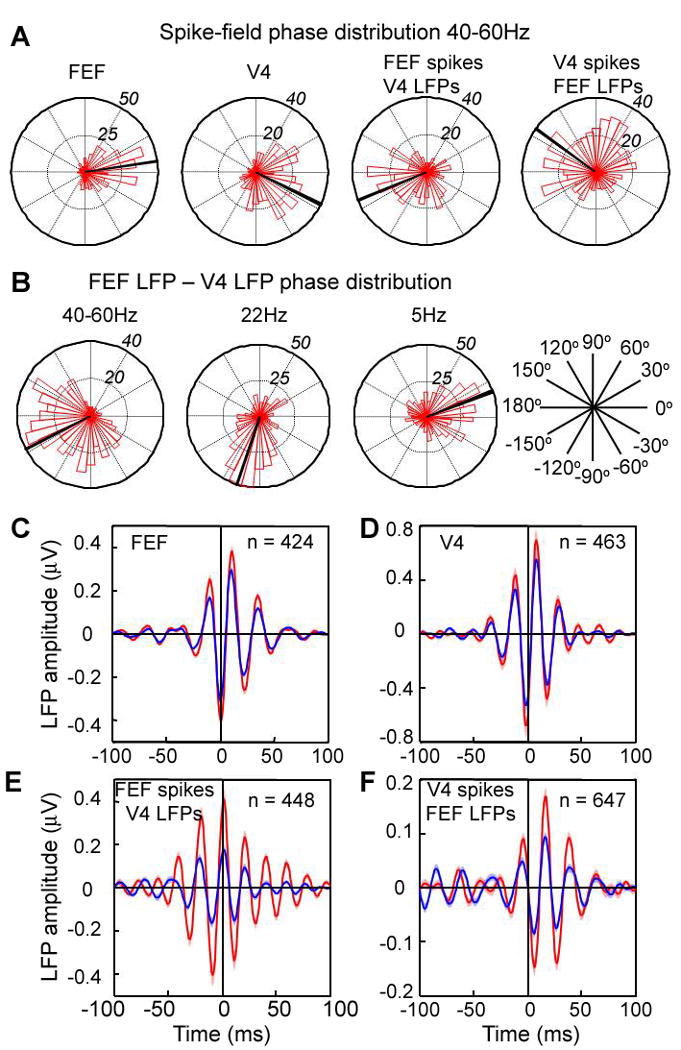
Relative phase. (A) Distribution of average relative phase (40-60 Hz) between spikes and LFPs within and across areas. (B) Distribution of relative phases between FEF and V4 LFPs at different frequencies (40-60 Hz, 22 Hz, 5 Hz). All phases from condition with attention inside the RF. (C-F) Spike triggered averages of LFPs filtered between 35 - 80 Hz with: (C) spikes and LFPs from FEF, (D) spikes and LFPs from V4, (E) spikes from FEF and LFPs from V4, and (F) spikes from V4 and LFPs from FEF. Conventions as in Fig. 1.