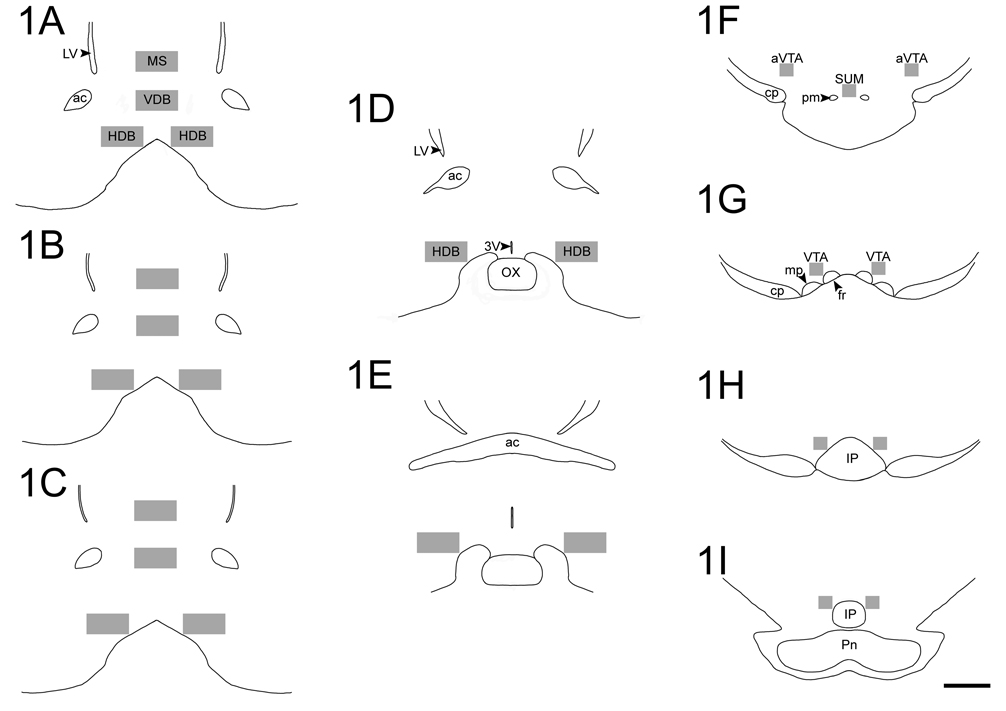
Figure 1.
Rostro-caudal illustrations depicting representative sampling areas used to quantify Fos expression in ACh and nACh cells of the MS, VDB, and HDB (A–E), as well as Fos expression in nTH and TH cells of the VTA and SUM (F–I). Boxes used for cellular counts had the following dimensions: (A–E) 600 µm × 300 µm and (F–I) 160 µm × 160 µm. Scale bar= 1 mm.

