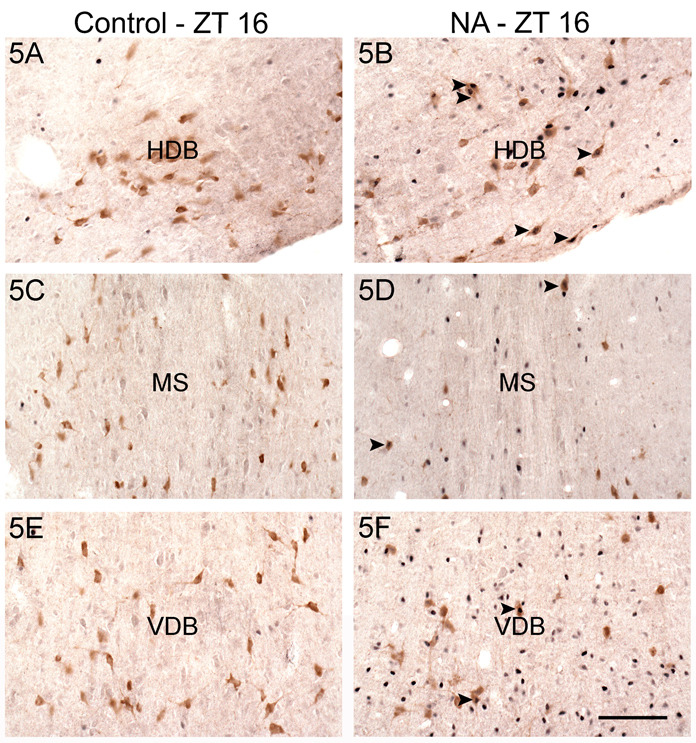
Figure 5.
Photomicrographs of ACh cells (ChAT- positive) expressing Fos in the HDB (A, B), MS (C, D), and VDB (E, F) of a control (A, C, E) and a NA grass rat (B, D, F) euthanized at ZT 16. Arrowheads indicate some double-labeled cells. Fos: blue nuclear staining. ChAT: brown cell body staining. Scale bar= 100 µm.

