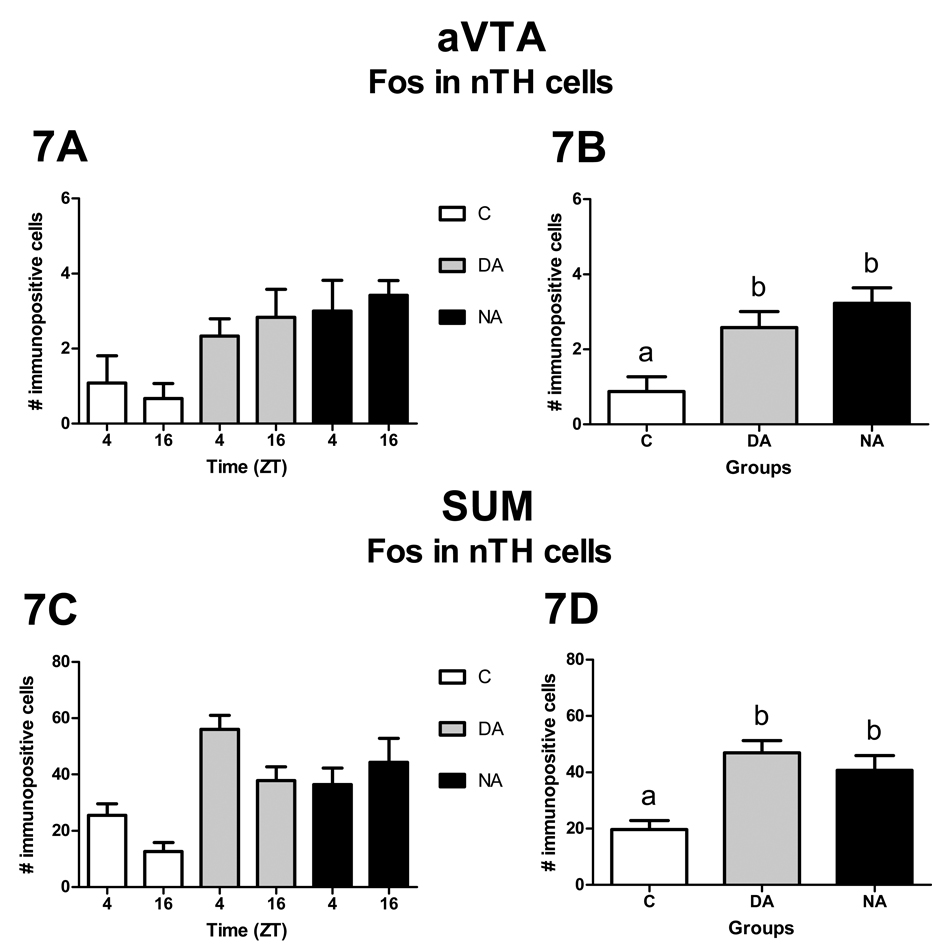
Figure 7.
Patterns of Fos expression in nTH cells of the aVTA (A, B) and SUM (C, D). Panels A and C show the distribution of Fos expression in nTH cells for each group at each sampled time. Neither the effect of ZT nor the interaction between ZT and group were statistically significant. Panels B and D show the overall distribution of Fos expression in nTH cells for each group. The effect of group was statistically significant (p< 0.05).

