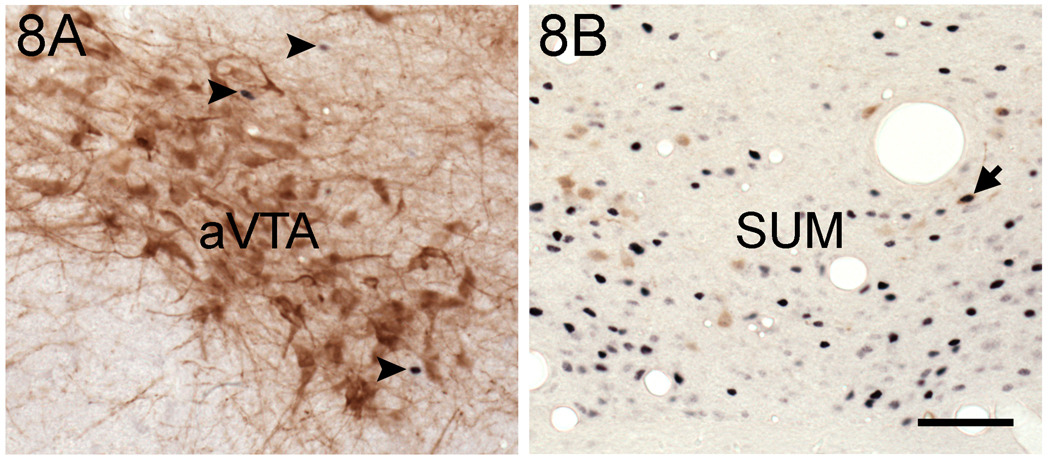
Figure 8.
Photomicrographs of Fos and TH cells in the aVTA (A) and SUM (B). Double-labeled cells were scarce (arrow in B) or absent in both areas. In addition, note that TH cells were abundant in the aVTA. However, these cells were not positive for Fos, even though this protein was observed in the vicinity of those neurons (arrowheads). Fos: blue nuclear staining. TH: brown cell body staining. Scale bar= 100 µm.

