
Figure 3.
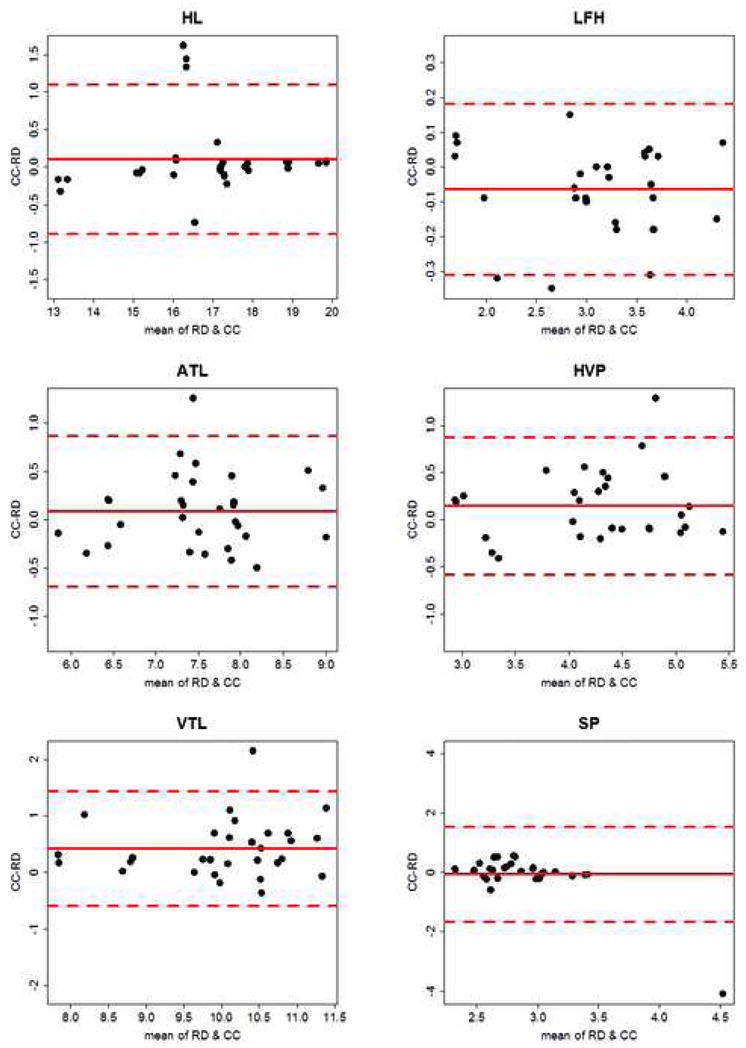
The Bland-Altman plots of HL, LFH, ATL, HVP, VTL and SP. The solid line is the mean difference d̄, and the dotted lines are d̄ − 1.96Sd (lower) and d̄ + 1.96Sd (upper).
Official websites use .gov
A
.gov website belongs to an official
government organization in the United States.
Secure .gov websites use HTTPS
A lock (
) or https:// means you've safely
connected to the .gov website. Share sensitive
information only on official, secure websites.
The Bland-Altman plots of HL, LFH, ATL, HVP, VTL and SP. The solid line is the mean difference d̄, and the dotted lines are d̄ − 1.96Sd (lower) and d̄ + 1.96Sd (upper).