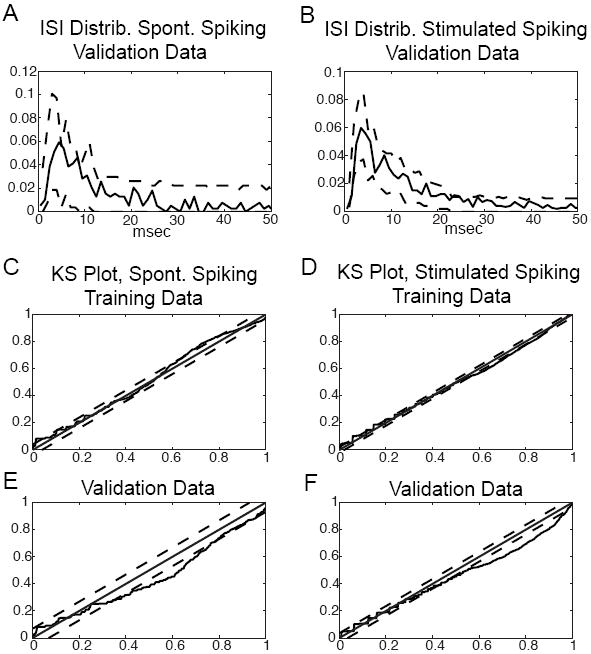
FIG. 11.

Cross validation of CSMs reconstructed from spontaneously firing and stimulus evoked rat barrel cortex on an independent validation training set. (A,B) ISI distribution of spontaneously and stimulus evoked firing validation sets and 99% confidence bounds bootstrapped from CSM. (C-D) Time rescaling plots of training data sets for spontaneously firing and stimulus evoked firing respectively. Dashed lines are 95% confidence bounds and the solid line is the rescaled ISIs. The solid line along the digagonal is for visual comparison to an ideal fit. (E-F) Similar time rescaling plots for the validation data sets.
