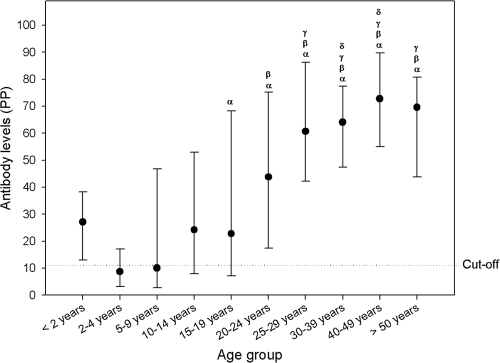
FIG. 2.
Distribution of levels of antibodies to Aichi virus by age. Levels of IgG antibody against Aichi virus were quantified by calculating the PP for each sample. In the graph, the dots represent median values, and the error bars represent the 25th-to-75th-percentile intervals. The dotted line marks the cutoff level. Greek letters represent significant differences (by the Mann-Whitney U test with Bonferroni's correction for multiple comparisons) from the 2- to 4-year-old group (α), from the 5- to 9-year-old group (β), from the 10- to 14-year-old group (γ), and from the 15- to 19-year-old group (δ). The 0- to 2-year age group was not included in the statistical analysis due to the low number of samples.

