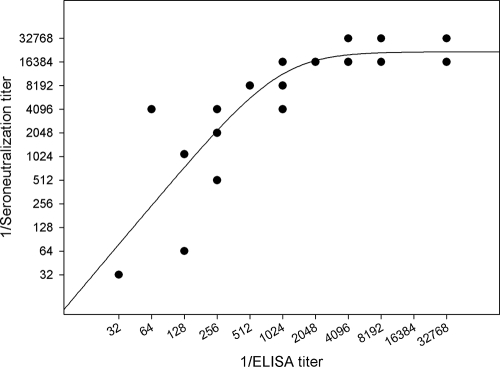
FIG. 3.
Relationship between ELISA titers and seroneutralization titers. The ELISA titers and seroneutralization titers of 23 randomly selected serum samples were compared. The graphic representation of ELISA and neutralizing titers fits the sigmoid curve well. This relationship was assessed by analysis of variance (P < 0.0001; R2 = 0.7046). Only 18 dots are shown, because several samples yielded the same values for ELISA and neutralizing titers.

