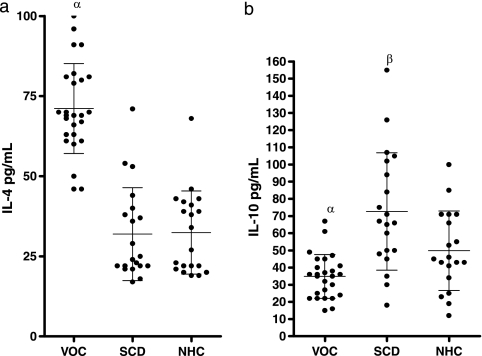
FIG. 2.
Distribution of serum IL-4 and IL-10 levels in patients in VOC, steady-state SCD patients, and normal healthy controls. (a) Serum IL-4 concentrations in patients in VOC (n = 26), steady-state SCD patients (n = 20), and NHC (n = 18) were assessed by ANOVA and posthoc tests. α, significant differences (P < 0.05) for VOC patients versus steady-state SCD patients and normal healthy controls. (b) Serum IL-10 concentrations in VOC patients, SCD patients, and NHC. Greek letters indicate significant differences (P < 0.05) between either VOC patients (α) or steady-state SCD patients (β) and NHC. Bars represent means and standard deviations.

