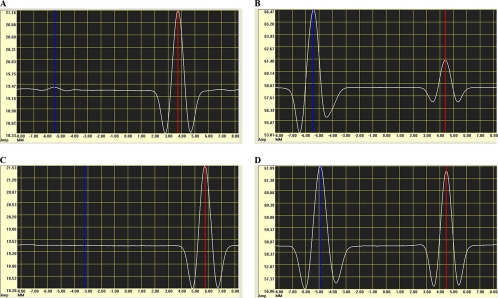
FIG. 4.
Graphic output generated by the magnetic assay reader. The blue line shows the reading of a test line, and the red line represents a control line. (A) Output from a negative taeniasis sample. (B) Output from a positive taeniasis sample. (C) Output from a cysticercosis negative sample. (D) Output from a cysticercosis positive sample.

