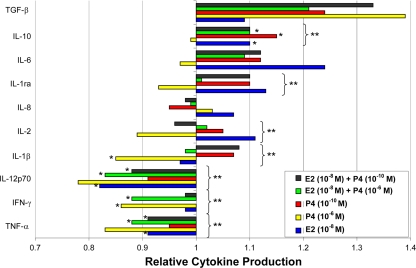
FIG. 4.
Mean relative cytokine production (± standard error of the mean) in PBMCs treated with E2 or P4 alone or in combination compared with that in non-hormone-treated cells stimulated with HPV-16 VLPs. The values presented on the x axis represent the relative difference (reference value = 1.0) in each cytokine concentration (y axis) due to hormone treatment compared to the cytokine concentration among PBMCs stimulated with HPV-16 VLPs but not treated with hormone. *, P < 0.05, by Student's t test, for comparison of the results for cells exposed to each individual hormone treatment and those for cells exposed to medium alone; **, P < 0.05, by two-way ANOVA, for comparison of the results for cells exposed to all hormone treatments and cells exposed to medium alone.

