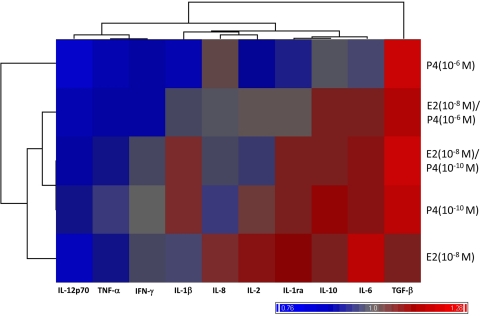
FIG. 5.
Hierarchical clustering of mean relative levels of cytokine production in PBMCs treated with E2 or P4 alone or in combination compared with those in non-hormone-treated cells stimulated with HPV-16 VLPs. Red shading denotes higher concentrations of a cytokine in response to a specified hormone treatment compared to the concentration of that cytokine produced by PBMCs stimulated with HPV-16 VLPs but not treated with any hormone (value > 1.0). Blue shading denotes lower concentrations of a cytokine in response to a specified hormone treatment compared to the concentration of that cytokine produced by PBMCs stimulated with HPV-16 VLPs but not treated with any hormone (value < 1.0). Gray shading denotes no change in the concentration of a cytokine in response to a specified hormone treatment compared to the concentration of that cytokine produced by PBMCs stimulated with HPV-16 VLPs but not treated with any hormone (value = 1.0). The similarities of these relative changes were correlated to one another by using the Euclidean minimum-distance-clustering algorithm, with the results being demonstrated in the column and row dendrograms.

