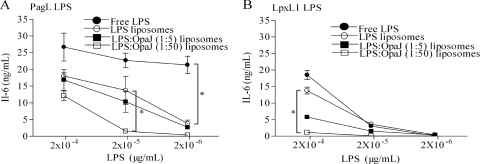
FIG. 3.
IL-6 induction in mouse macrophage cell line J774A.1 by PagL LPS (A) and LpxL1 LPS (B). Tested were free LPS, liposomes with incorporated LPS, and liposomes with coincorporated LPS and OpaJ at LPS/protein ratios of 1:5 and 1:50 (μmol/μg). The IL-6 concentration in the supernatant of cell cultures was quantified by ELISA. The data represent the averages and standard errors from three independent experiments. Statistically significant differences between liposome preparations are marked with one asterisk (P < 0.05).

