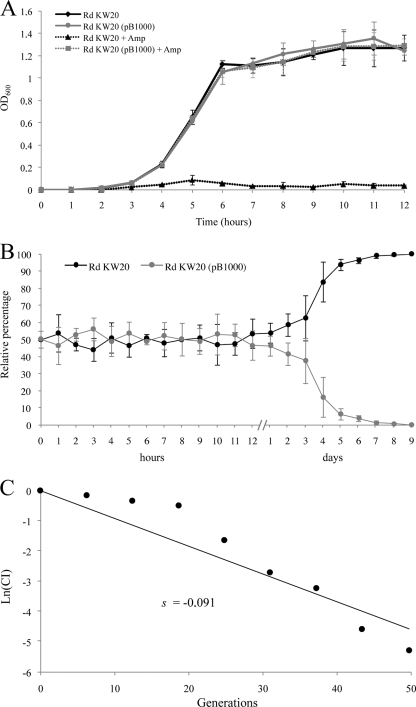
FIG. 3.
Fitness cost of pB1000 in H. influenzae. (A) Comparison of the growth kinetics of strains H. influenzae Rd KW20 and H. influenzae Rd KW20(pB1000) in the absence and presence of ampicillin. Error bars represent the standard deviations of the means. Growth curves were constructed with the average results from three independent experiments. (B) Growth competition between H. influenzae Rd KW20 and H. influenzae Rd KW20(pB1000). The initial ratio was 1:1. The relative percentage of each strain at different time points is shown. Competition curves were constructed with the average results of four independent experiments. (C) The selection coefficient (s) was calculated from the competition experiment. s is the slope of the linear regression model, ln(CI)/ln(d), where CI is the ratio between the CFU counts of the resistant and susceptible populations at t1 divided by the same ratio at t0, and d is the dilution factor.

