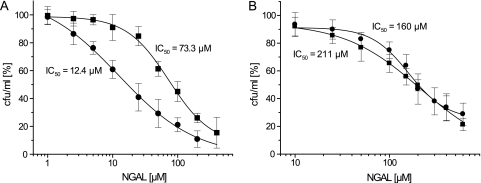
FIG. 5.
Determination of half-maximal inhibitory concentrations (IC50) of NGAL with respect to bacterial growth in iron-limited cultures in the presence of 50 μM NE and 50 μM holoTf. (A) Dose-response curves of B. subtilis WT (filled circles) and ΔdhbC (filled squares) cultures. (B) Dose-response curves of E. coli WT (filled circles) and ΔentC (filled squares) cultures. Viable cell counts for each NGAL concentration were related to cell counts of control cultures in the absence of NGAL (corresponding to 100%). All data points represent average values of three independent biological replicates, and error bars indicate the corresponding standard deviations.

