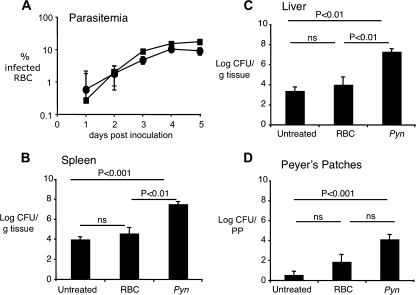
FIG. 2.
Colonization of mice during infection with individual pathogens and during coinfection. (A) Parasitemia levels in mice infected with P. yoelii nigeriensis alone (squares) and during coinfection with S. Typhimurium (circles). Data represent means ± standard deviations (SD) for five mice. (B to D) Organ colonization by S. Typhimurium 5 days after i.g. infection of untreated mice, mice injected i.p. with naïve cells (RBC), or mice injected with red blood cells containing P. yoelii nigeriensis (Pyn). Numbers of CFU from the spleen (B), liver (C), and PP (D) are represented as the means ± standard errors of results from groups of 9 to 17 mice. Statistical significance was analyzed by using a Kruskal-Wallis nonparametric ANOVA followed by Dunn's multiple-comparisons test. P values for each pairwise comparison are shown. ns, not significant.

