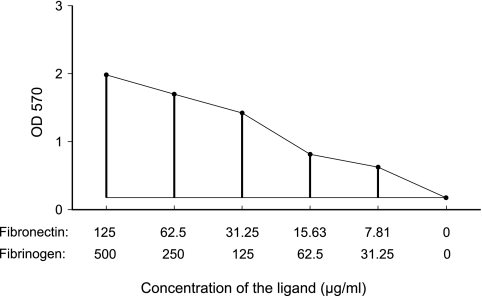
FIG. 1.
Relationship between ligand concentration and adherence measured using optical density. The adherence value was calculated as an approximation of the area under the curve as follows. The optical density values for all concentrations were added, and the control value (which represented the optical density when no ligand was present) was multiplied by six and subtracted from the sum.

