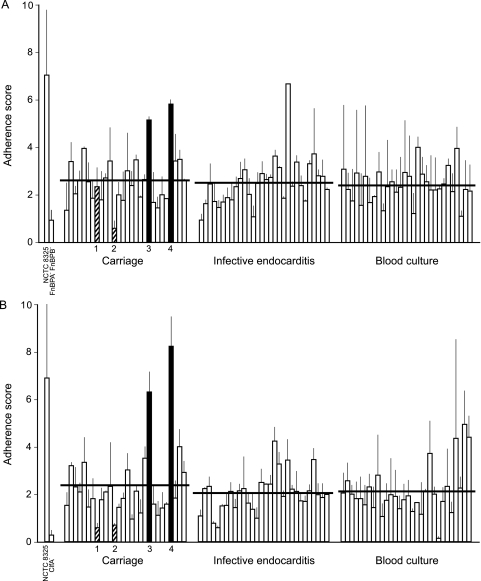
FIG. 3.
Adherence of S. aureus carriage and infection isolates to fibronectin (A) and fibrinogen (B). The bars and error bars indicate the average and standard deviation for each isolate (two assays per isolate). The average for each category is indicated by a horizontal line. Isolates which were used for testing in the experimental endocarditis model are indicated by filled bars (high adherence) and striped bars (low adherence) and numbers.

