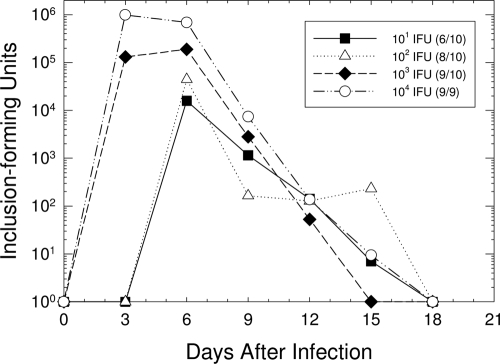
FIG. 1.
Kinetics of urethral infection in male guinea pigs following inoculation with different doses of chlamydiae. Each data point represents the mean number of IFU for animals that became infected. To the right of each dose in the key, the ratio of the number of animals that became infected to the total number of animals inoculated with that dose is given in parentheses. The infection courses of animals infected with 101, 102, and 103 IFU were significantly different from those of animals inoculated with 104 IFU.

