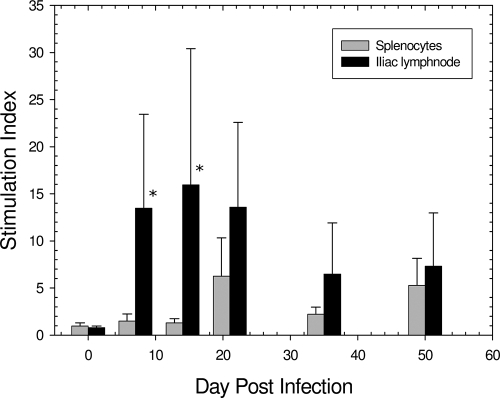
FIG. 6.
Proliferation responses of iliac lymph node and splenic cells to chlamydial antigen. Each bar represents the mean stimulation index for 6 animals, and each error bar represents 1 standard deviation. Asterisks indicate that the difference between the response in the iliac lymph node and the response in the spleen was significant (P < 0.001).

