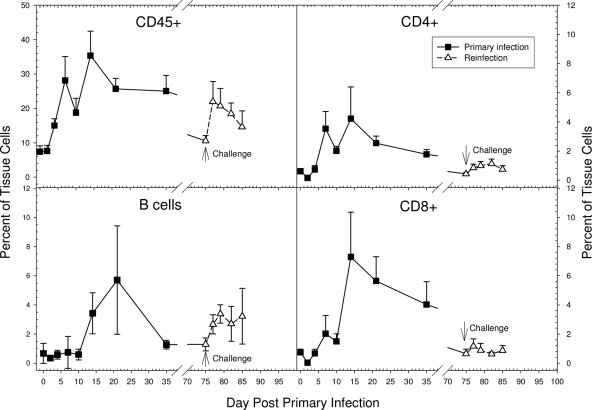
FIG. 7.
Kinetics of the cellular response in the urethra following primary and challenge infections as assessed by flow cytometry. Each data point represents the mean and standard deviation for 5 animals. The number of CD8 cells on day 14 was significantly greater than the number of CD4 cells (P = 0.008). The number of B cells following challenge infection was significantly greater than the numbers of CD4 and CD8 T cells on each of the days following challenge (P, <0.01 to 0.001).

