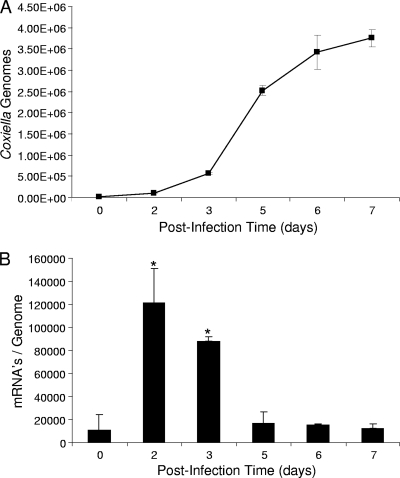
FIG. 5.
bcp gene expression is maximal during early log-phase growth of C. burnetii in synchronized infections of cultured Vero cells. (A) Coxiella growth curve showing numbers of genome equivalents as a function of postinfection time, as determined by Q-PCR of the same source cultures used in qRT-PCR. (B) Corresponding qRT-PCR results, showing bcp mRNA transcript values normalized to the Coxiella genome equivalents. The qRT-PCR and Q-PCR values represent the means ± standard deviations of the results of 6 independent experiments. Asterisks denote a statistically significant increase in bcp mRNA relative to the day 0 postinfection value (P < 0.05).

