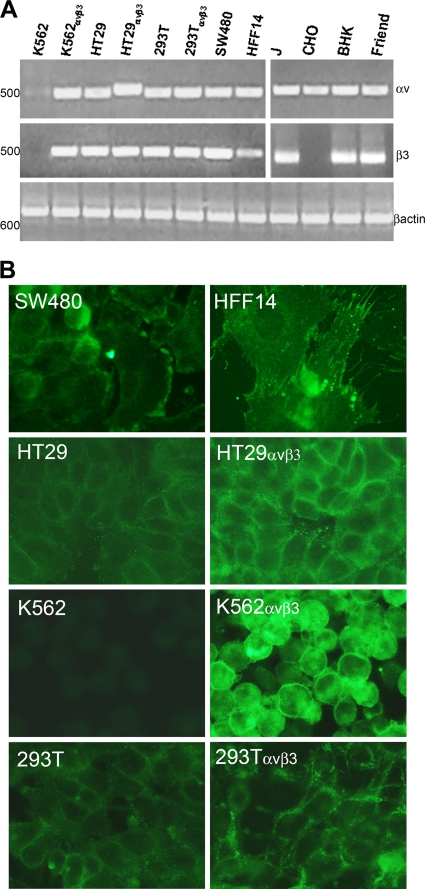
FIG. 2.
Expression of αV and β3 integrin subunits. (A) Detection of αV and β3 integrin transcripts by RT-PCR. The cDNA of the indicated cells was amplified by means of αV integrin or β3 integrin primers annealing to the human (left) or rodent (right) isoform. As a control for RT-PCR, all of the cells were checked for β-actin expression. The values on the left represent the migration positions of 500- or 600-bp markers. (B) IFA detection of αVβ3 integrin by means of MAb LM609. All pictures were taken with the same exposure time by means of a 63× objective. All of the inserts in panel A, except that relative to β3 on the right, were modified by Photoshop software as follows: −35% brightness, +30% contrast. HFF14 insert in panel B: brightness, −20%; contrast, +20%. All of panel B: brightness, +40%; contrast, +100%.

