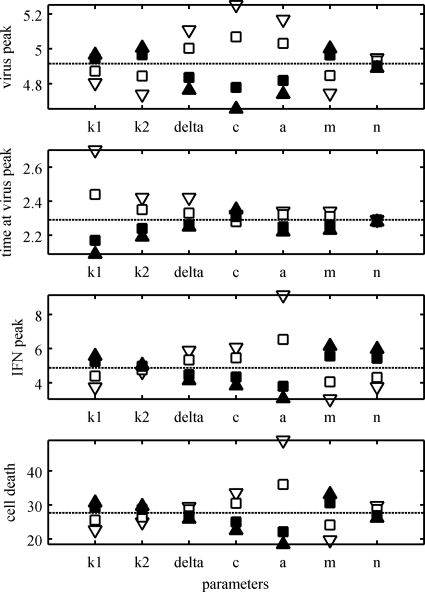
FIG. A3.
Sensitivity of the model parameters. The parameters k1, k2, δ, c, a, m, and n were varied, one at a time, and the model dynamics were calculated. The virus peak, the time when the peak occurred, the IFN peak, and the total percentage of cell death are shown (the dotted lines show the dynamics at baseline values). The parameters were varied between 0.5 (open triangles), 0.75 (open squares), 1.25 (filled squares), and 1.5 (filled triangles) of their baseline values (shown in Table 1).

