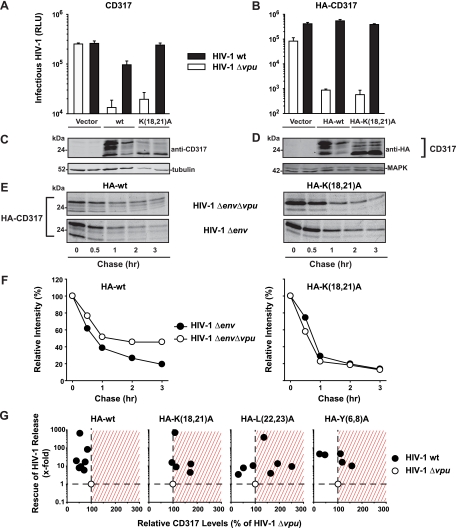
FIG. 3.
Effects of provirally encoded Vpu on the WT and mutant HA-CD317-imposed restrictions of HIV-1 release and on HA-CD317 protein levels. Histogram bars show the levels of infectious virus secreted from 293T cells expressing either WT HIV-1 or HIV-1 Δvpu and vector, CD317, or CD317 K(18,21)A (A) or vector, HA-CD317, or HA-CD317 K(18,21)A (B). Shown are arithmetic means ± SD of triplicates from one experiment representative of 5 to 7 experiments. (C and D) Western blot analyses of corresponding 293T cell lysates. (E) Pulse-chase radiolabeling. 293T cells transiently expressing HA-CD317 or mutants together with HIV-1 Δenv or HIV-1 Δenv Δvpu were pulse-labeled with [35S]methionine and then incubated with chase media for the indicated times (hours [hr]). After immunoprecipitation with anti-HA antibody, proteins were separated by SDS-PAGE and the gels were subjected to autoradiography as previously described (4). (F) The relative intensities of the HA-CD317 bands were quantified, and values at 0 h were set to 100% and graphed. Given are the results of one of two independent experiments. (G) 293T cells were transfected with pHIV-1 wt or pHIV-1Δvpu and the indicated HA-CD317 expression constructs. Relative levels of HA-CD317 and MAPK protein in cell lysates were quantified by use of the Odyssey infrared imaging system and Odyssey software. The ratio of HA-CD317 to MAPK for HIV-1 Δvpu-coexpressing cells was set to 100% (x axis). The y axis depicts the factor of titer enhancement of WT HIV-1 relative to the value for HIV-1 Δvpu, the latter of which was set to 1 in each experiment. Each circle represents the result of one of 5 to 7 independent experiments.

