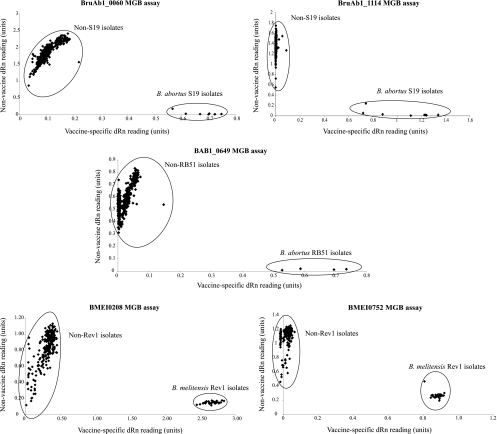
FIG. 1.
Allele discrimination plots generated by the individual MGB assays examining either 498 (in the case of strains S19 and RB51) or 277 (in the case of strain Rev1) isolates. In all cases, two distinct populations can be seen: vaccine (closest to the x axis) and nonvaccine (closest to the y axis).

