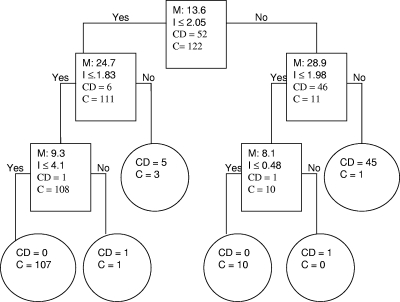
FIG. 1.
Biomarker pattern software based on CART analysis was used to generate candidate diagnostic algorithms. The CART procedure seeks to minimize a cost function that balances prediction errors in either sense (e.g., false-positive or false-negative results) and the total number of biomarkers used. Equal weight is given to false-positive and false-negative results. The relative importance of each peak in any given algorithm is measured by the order in which it is selected in the decision tree and the number of correct predictions credited to it. An example of decision tree classification in the training data set, using CD and control (C) (VHC, CHC, and OPD) samples, is shown. The numbers in the root node (top box), the descendant nodes (lower boxes), and the terminal nodes (ovals) represent the biomarker peak mass (M [kDa]), the peak intensity criterion (I), and the class (CD and C), respectively. In this algorithm, the intensities of the 8.1-, 9.3-, 13.6-, 24.7-, and 28.9-kDa biomarkers establish the splitting rules. Cases that follow the rule are placed in the left daughter node (yes), and samples that do not follow the rule go to the right (no) daughter. For example, the first splitting-rule question asks the following: “Does the peak at 13.6 kDa have an intensity of ≤2.05?”

